A question that has been rattling around my brain for a while now is this: how useful is “form” in predicting the outcome of football matches? That is, how useful is it to know that a team’s record in their last 5 matches is WWLDD, for example? So I thought I’d explore this as a way to learn a bit more about Python’s statistics and data science libraries. The code used to do this analysis and generate these graphs is available on github.
Data
First thing’s first, we need some data.
Happily, there’s already a
database of Football League results
dating back to the 1880s
available in CSV form.
This dataset is wonderfully clean, so there’s very little messing about we need to do with it before we start.
Unfortunately, the data set doesn’t contain columns for each team’s form, so we need to produce these ourselves
by looking at the results of each team’s previous matches.
There are about 200,000 matches listed here, which means that this initial manipulating of the data
takes about 10 minutes to run on my laptop.
I imagine there’s a cleverer way to do this, but this is currently the one place where I’ve resorted to
Panda’s apply method.
You might wonder whether it would be better to restrict attention to, say, matches after 1981
when the Football League adopted three points for a win;
or to just the top tier; or whatever other cutoff might appeal.
For reasons we’ll return to later, the more data the better, at least for this current first pass analysis.
Scoring and benchmarking
Now let’s turn to refining the question we are trying to ask.
What kind of prediction are we trying to make?
Football is a pretty random affair, so I think it’s best to make probabilistic forecasts about
the result of each match.
That is, for every match, we are going to give probabilities for the three outcomes:
home_win, home_loss and draw.
(Throughout this post, I’ll just use “win”, “lose”, “draw” to mean the outcome for the home team).
And what makes for a good probabilisitc prediction?
We’re going to assess how well the predictions perform using
a scoring rule.
I actually did the calculation with two different scores,
but there’s not much difference between the conclusions, so I’ll mostly just discuss
the log score below, and those interested in how the numbers look for the Brier score can
run the analysis themselves.
The basic idea is that if you put a high probability on something that actually happens,
that’s good, and if you put a high probability on something that doesn’t happen, that’s bad.
So the question now becomes: how much can you improve your score
by taking into account the form of the teams?
The numbers that these scoring rules produce aren’t really that helpful, so we’re going to manipulate them into a form that (sort of) means something. I hope I’m not doing something very silly in scaling the scores in this way, I’m sure someone will tell me if I am. In order to scale the scores, we need sensible benchmarks for “the worst possible forecasting method” and “the best possible forecasting method”. We can then set the scores these methods get to 0 and 1, and scale all other scores to be between these two. So what’s the crudest, dumbest method of making predictions? Well, there’s three outcomes – win, lose, draw – so let’s predict 1/3 for each outcome. In the absence of any information, that’s perhaps a good starting point. Call this method the “thirds” method: it gives us our lower baseline. What about the best prediction method? Obviously, assigning probability 1 to the actual outcome for every match would get you the best score, but that’s impossible, so how well can we possibly do without being omniscient? Arguably, bookie’s odds provide the closest thing to an optimal probabilistic forecast that we can hope to get. Now is not the time to get into the efficient market hypothesis and the wisdom of crowds. Let’s just say, if there were a method to consistently outperform the bookies’ probabilistic predictions, there’d be no bookies left. Happily, another data source exists that records bookie’s match odds, and from this, we can extract their implied probabilities. (I’m using the average match odds, rather than the odds from a specific bookie). So the score that the bookie’s implied probabilities gets is a reasonable benchmark for how well we can possibly do in the game of probabilistic predictions for football games. This benchmark is, in fact, just the average score for the 2020/21 Premier League season.2 These two scores are then used to set the 0 and 1 values – the worst and best possible scores – of our scale.
Improving on “thirds”
One obvious improvement over the crude “thirds” method would be to take into account the fact that fewer than one third of games end in a draw. The actual figure is closer to 25%. How do we use this information to improve the prediction? Throughout, I’m going adopt a very crude method for making use of information: if we know that something happens x% of the time, we predict that it will happen x% of the time. So our first improved prediction is to predict that draws happen with the actual observed frequency in the “training” data, and that (home) win or loss probabilities are each assigned half of the remaining probability mass. This gives us a prediction we will call “Win/draw”. The improvement is modest: thirds got us a scaled score of 0, while Win/draw gets us 0.08 on the scaled log score.
In practice what I’ve done is used data up to the 2017/18 season as “training data”
and then used the 2018/19 and the 2019/20 season up to March (where the engsoccerdata data stops)
as “testing data”.
So the relative frequency of draws in the data up to the 2017/18 is about 25%,
and if your probabilistic prediction of win/loss/draw is 0.375/0.375/0.25,
for every game in the testing data (i.e. the season and a half up to March 2020)
then your scaled log score is about 0.08.
The above “Win/draw” method doesn’t use any information about the specific match to make its prediction. One simple piece of information that will be informative in this context is knowing which of the teams is the home team and which is the away team. The data here is all about league matches, so there’s no neutral grounds or other such complicating factors. In the training data, a home win happened about 51% of the time, draws about 25%, and home losses about 24% of the time. So using those numbers to predict the outcomes of the testing data gives us scores of: 0.10. Call this kind of prediction “home advantage”. This value for home advantage seems remarkably high, and one thing I hope to do in the future is figure out whether this is actually right, or whether something has gone wrong with the data.
The impact of form
By “form” I mean the record of wins and losses in the last few matches. We’ll look at different “lengths” of form, e.g. performance in the last 3 matches or the last 5. And again, the inference will be crudely frequency based: if x% of teams whose form was WWDLL went on to win their next game, we predict x% to win for every team with that form. There are in fact four different ways I used form to make predictions. First, we predict the outcome of the games based on the home team’s form (and look at lengths of form from 1 to 6 games). Then we can also predict using only the away teams form. Next we can look at the form of one team without knowing whether that team is home or away. And finally we can look at the form of both teams.
To do this, we need quite a lot of matches. For length 6, there are 729 possible sequences of W,L and D (that is, 3 to the power 6), and we need lots of matches in each category in order to have sensible estimates of the frequencies. Even with 200,000 matches in the dataset there are some form categories at length 6 that only have 50 or so members, and we can’t look at longer lengths of form without having some categories become empty. The problem is doubled for looking at both team’s form, since even looking at 3 matches for each team is 6 total matches worth of information… And of course, the longer the length of the form we want to look at, the more games we have to throw out where teams have not played that many games yet in the season. (To reiterate an already implicit caveat: this is league form, so cup competitions, international breaks etc are not being taken into account).
The following graph illustrates how the various predictions based on different lengths of form score.
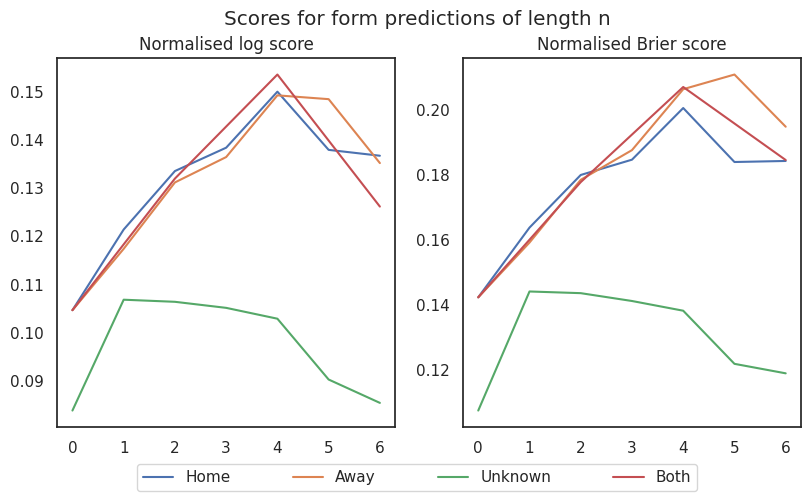
These graphs show normalised score versus number of games of information used in prediction. For the “both” prediction there are only data points for the even numbers since a form of length n is 2n games worth of information. I’ve set the zero-length form predictions to be the home advantage prediction, apart from for the unknown team form prediction, which is set to win/draw. So what conclusions can we draw from this graph? Putting aside the unknown prediction for a second, it’s kind of surprising to me that you do about as well predicting based on n games for both teams or 2n games for either home or away team. And it’s also surprising to me that four game’s worth of information is about as much as it’s worth taking into account. Any more and we seem to be overfitting. There is, of course the possibility that some of the above is an artefact: bigger length form predictions are based on frequencies in smaller categories, so I’d like to repeat this exercise incorporating more data (for example, data from other leagues). Also, knowing which team was the home team seems to be about as useful as knowing how the team performed in their last match.
But the main take away is that none of this stuff is very informative: note the y axis only goes up to 0.15 or 0.20, whereas the bookie’s odds score 1.
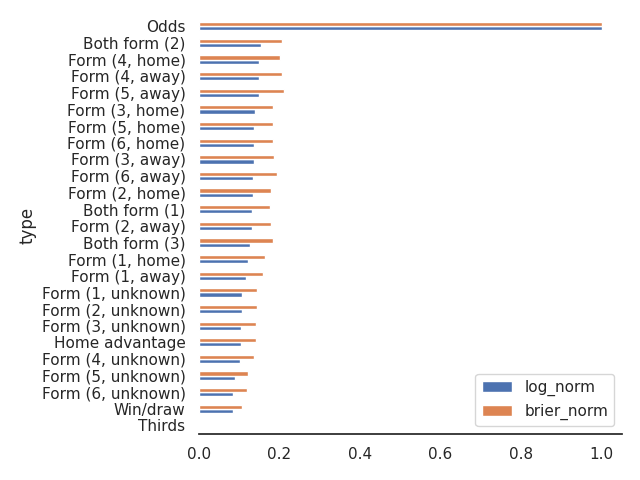
Here, finally, is a big summary of all the prediction methods we’ve discussed.
Future
There’s lots of interesting things to do with this data that I might explore in the future.
Working with just the form stuff, I’d like to figure out a more sophisticated way
of generating the game histories for each team so as to make it practical to
incorporate a bunch more leagues.
I feel like there are ways I can use groupby and vectorised string methods
to generate the histories quicker than my naive apply solution.
I also think I can cluster form categories together based on a simple distance
over form strings (Hamming distance, or something more sophisticated).
This might allow us to explore the extent to which the loss of score for longer form histories
is an artefact.
I think it would also be interesting to explore how the bookie’s odds score has changed over time, but this would involve programmatically downloading a bunch more seasons from football-data. We could also look at whether the score differs across different leagues: are bookies more accurate on the Premier League or lower leagues, or foreign leagues? Or across different times during the season: do bookies do better early in the season? do international breaks affect bookie’s accuracy? Are more recent games more useful, or is it just as informative to know how the team was doing a few games ago? I would kind of think the answer to this last question is “of course it’s more useful to know the last game, rather than a game a few weeks ago”, but I don’t know how much of a bonus the recency of the game would be. Does home advantage vary over the course of a season? Or is there a historical trend in home advantage?
I imagine that a lot of these questions have already been explored by people with more knowledge and possibly better data than I have, but that won’t stop me! After all, the goal is to learn more about Python’s suite of scientific packages, rather than add to the sum total of knowledge about football.